 Interactive New Build Index
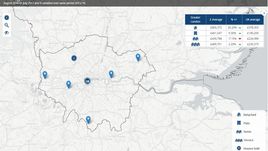
The Interactive New Build Index shows recent new-build house prices displayed in an interactive map that you can drill down into.
Where possible a Google street view image will be shown to allow you to get a sense of how the area currently looks.
 Historical House Price Explorer
The LSL Land & New Homes historical house price explorer allows you to see how much properties sold for for any geographical region. At post code level you will see a distribution graph showing the pattern of house price changes over time. Data is from Government sources and ranges from 1995 to July 2017 and shows new build and secondhand property sales.