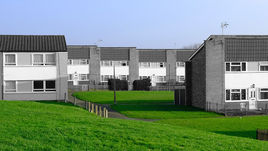
The Department for Communities and Local Government recently published a comparison of the English Housing Survey (EHS) first published in 1967, to the most recent survey published in 2017. (Data covers 1965 to 2015).
This post will take a look at some of the key changes that have taken place over the last 50 years.
Tenure
Fifty years ago more than half (51%) of the English housing stock was owner occupied, 29% was rented in the social rented sector and 20% was privately rented.
Fifty years later, 63% of the stock was owner occupied, 17% was in the social rented sector and 20.1% was privately rented.
It is interesting to note that the number of properties privately rented (20%) remains almost unchanged, with a marginal 0.1% difference.

It is perhaps unsurprising that there has been a 40% decrease in the proportion of the population living in social housing since the 60s.
However, this ‘snapshot’ comparison does not show the substantial changes to tenure during the intervening period, especially in the private rented sector.
The graph below shows what been happening since the 60s.

The proportion private renters dropped throughout the 1950s, 1960s and 1970s, hitting a low point of 9.0% in 1992.
Social renting, on the other hand, steadily increased over the same timescales, reaching a peak in 1981 of 31.7%.
From the turn of the century the number of owner occupiers rapidly increased and plateaued in the 90s. From 2006 there was a slight reduction of owner occupiers with a matching increase in private renters.
Housebuilding
The graph below shows the number of completions by developer type from 1946 to ~2016.

The number of housing association completions has increased steadily and consistently since the 40s.
The well-publicised reduction of local authority spending on building projects is very evident, with a gradual reduction to a low point of 50 completions in 1999. Since then there has been a very gradual recovery, which should be boosted as a result of the recent budget.
Household size
Since the 1960s households have become significantly smaller. The “50 Years of the English Housing Survey” document makes use of census figures to show that the average household size in 1961 was three people, but by 2015/16 this had reduced to 2.4 people.
This was in part due to a large increase in the number of one or two person households, which in 2015/16 made up 64% of households, compared to 43% in 1961.
There has been a corresponding increase in the number of under-occupied homes. Over the last 20 years, under-occupation in the owner occupied sector has increased to the point where over 50% of owner occupied households are under-occupied in 2015-16. (Where under-occupation is defined as a property having two or more unoccupied bedrooms).
Source https://www.gov.uk/government/publications/50-years-of-the-english-housing-survey


