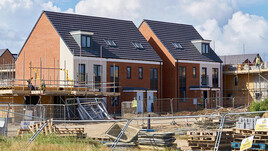
In the year to end July 2017 new build house prices rose on average by 5.5% across the UK which is unchanged on last year’s figure. If Greater London is taken out of the calculation and we take a crude average of the remaining regions, then the average house price growth is 4.3% compared to a figure of 4.0% last year. In common with other indices, we are seeing a ripple effect as the heat has now come out of the London market and a gentle price wave moves out across the regions.
But the gradual decline in household incomes and general economic uncertainty seem to be creating a cautious environment. Even the prospect of continuing low interest rates is not generating buyer activity at anything like the levels seen in the run up to the market crash a decade since.
Continued in the full report - please click on the link below to open...
Note: This month’s figures are based on projected data, generated whilst work is being undertaken on the data collection system.
Click here to read our full report

Click here to view an interactive price-change map


