In the year to end March 2020 new build prices per m² rose by an average of 2.76% across the UK...
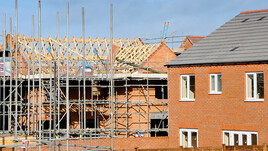
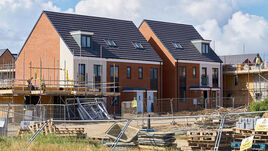
The New Build Property Market
Due to Covid19 the New Build index has been postponed until further notice.
However, our analysis of new build registration data to Sept 2019 has been provided
in the partial report below.
Our analysis of average house prices per m2 based on data from eSurv and the the First Time Buyers Affordability Index have also been included.
Thank you
Continued in the partial report below - please click below to open...
Click here to read our partial report

The North / South divide excluding Greater London can be seen below:

Click here to explore historical house sale prices
Click here for the New Build Index archive
LSL market intelligence indices and reports