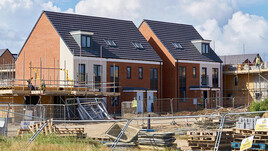
In the year to end Dec 2018 new build house prices rose on average by 2.2% across the UK which is down on last year’s figure of 10.8%
The New Build Property Market
We start the new year by rounding up housing market performance over the past year, based on a variety of sources. Whilst no one source is particularly upbeat, the performance of the market depends on who you are talking to, and there are some rays of sunshine breaking through the clouds, if you know where to look.
The RICS UK residential housing market forecast for 2019 anticipates little change on the relatively weak market conditions that have been experienced over the past year. They report that not enough second-hand houses are coming on to their books to replace the houses being sold, and forecast that sales volumes are expected to weaken by about 5% during 2019. Market uncertainty, affordability issues and the potential for interest rate rises are cited as the reasons behind their prediction that average prices will stagnate during 2019. That said, price falls are not anticipated due to the restricted supply of property for sale. A decline in the availability of homes to let is expected to create some growth in rental prices. The RICS (Royal Institution of Chartered Surveyors) have said that uncertainty amongst both buyers and sellers, revolving around Brexit, is slowing market activity. There an expectation that once some form of resolution over Brexit is found, sentiment will improve and the market will start to pick up.
The latest housing market report from the RICS saw a continuing fall in activity indicators with sales volumes continuing to reduce. Across the UK sales expectations for the coming three months are either flat or negative, with a net balance of -28%, which is the weakest reading since the series was started in 1999. Except for London and the South east, prices are expected to rise slightly or hold steady, but this is against a background of a lack of supply and and shortage of buyers.....
Continued in the full report - please click below to open...
Click here to read our full report

The North / South divide excluding Greater London can be seen below:

Click here to view an interactive price-change map
Click here to explore historical house sale prices
Click here for the New Build Index archive


