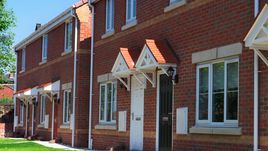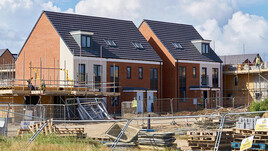
In the year to end May 2018 new build house prices rose on average by 5.8% across the UK which is down on last year’s figure of 10.2%
The New Build Property Market
The North East is still experiencing sales at an average price that is 6% below the 2007 to 8 peak. But the three indices are all showing relatively strong price growth in this region which is now averaging 4% year on year growth. At the other end of the spectrum London has experienced strong and sustained house price growth since the last peak, having risen by 62% over the period to the present day. However, whilst year on year prices were increasing by 15% two years since they have declined rapidly in recent times and the average year on year figure is now near -1%.
In between these extremes it is clear that the property market is showing its traditional North / South divide and that the Northern regions are seeing stronger and rising growth whilst the Southern regions are now cooling down.
The London market is probably now an exception as its growth to become the leading financial centre and the influx of overseas money have caused prime London to disengage from the wider UK property market. But generally speaking in past cycles, inflation has led to wage growth and eventually this has made property look cheap, so demand has increased and prices have risen. But we are now in a low inflation economy and wage growth is at best sluggish. The main thing that has changed is in the past decade is affordability, whereby low interest rates and some limited wage growth have created some stimulus to house price growth. But whilst some growth is now happening in the North, it doesn’t seem likely that this will drive up into the double digit growth that was seen in previous cycles....
Continued in the full report - please click below to open...
Click here to read our full report

The North / South divide excluding Greater London can be seen below:

Click here to view an interactive price-change map
Click here to explore historical house sale prices
Click here for the New Build Index archive


North / South divide and cost per square meter results are based on data from eSurv


