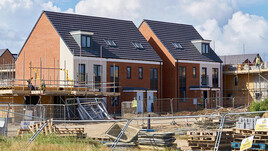
In the year to end October 2019 new build prices per m² rose by an average of 2.86% across the UK...
The New Build Property Market
The Rightmove House Price Index, which tracks property coming to market, has recorded a 1.3% fall in the price of property over the past month. Whilst such slight price drops are to be expected at this time of year, the number of new sellers coming to the market has fallen by 14.9% on the same period last year which is the largest year on year drop since August 2009.
In contrast to this however is the number of sales actually agreed which is only 2.9% down on the same period last year. It seems that the continuing Brexit turmoil, combined with the upcoming general election, are leading to a ‘wait and see’ attitude amongst sellers, despite the fact that there are clearly buyers in the market.
At a regional level the Rightmove House Price Index (which shows both time to sell and asking prices), shows that most of the Midlands, Wales, North and Scotland are seeing price rises in the 1 to 3% price band, whilst Greater London, East of England and the South East are experiencing year on year falls of around 1%. The overall picture seems to point quite clearly to an issue of confidence in the future, rather than any fundamental imbalance in the property market...
Continued in the full report - please click below to open...
Click here to read our full report

The North / South divide excluding Greater London can be seen below:

Click here to explore historical house sale prices
Click here for the New Build Index archive
LSL market intelligence indices and reports


