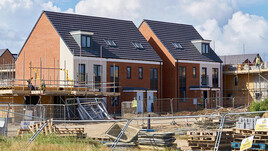
In the year to end August 2018 new build house prices rose on average by 5.1% across the UK which is down on last year’s figure of 9.8%
The New Build Property Market
We have looked at the most recent annual house price change data from three leading indices: Nationwide, HM Land Registry / ONS and LSL Acadata. The results are shown in the table below where HM Land Registry / ONS data is used to show the average house price at regional level from the 2007 peak and the latest average price. The next column shows the percentage change from this peak to present and the final column shows the average house price change over the past year as derived from the above mentioned three indices.
Whilst there are some quite significant differences between the reported price rises for each region, the picture is clearly one of a wave that has now spread out to the regions from London where prices are now around 60% above the level they were at in 2007. The adjoining regions of East and South East have seen growth approaching 40% and moving further out the South West, East Midlands and West Midlands have seen growth close to 20%. The North West and Yorkshire and the Humber are only experiencing house prices that are 5 to 10% above that seen in the last boom and the most Northerly region, North East is still nearly ten percent below the previous peak.
At present, based on the average figures, no region is presently seeing negative price change. The East and West Midlands are the strongest English regions, whilst other regions are either cooling down or showing some slow signs of growth.
The August 2018 RICS Residential Market Survey mirrors the above price data and reports strong markets in terms of sales volumes and price rises in Scotland and Northern Ireland. Across the UK as a whole new sales instructions have dropped, but activity is expected to be stronger away from the South of the country...
Continued in the full report - please click below to open...
Click here to read our full report

The North / South divide excluding Greater London can be seen below:

Click here to view an interactive price-change map
Click here to explore historical house sale prices
Click here for the New Build Index archive


