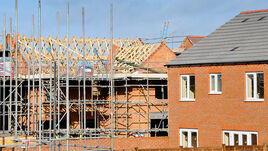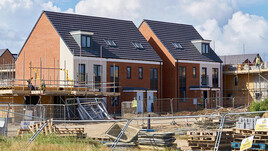
In the year to end February 2020 new build prices per m² rose by an average of 2.43% across the UK...
The New Build Property Market
2020 has seen fires in Australia, floods across the UK and now we jointly face Covid 19. A few short months since we were looking forward to putting the uncertainty of Brexit behind us, but we now face even greater uncertainty.
Other news pales into insignificance compared with the economic and social issues arising from Coronavirus so it is perhaps worth considering a few potential consequences. Whatever happens, people will still need property to live in and the level of demand for housing will remain largely unchanged.
The Government will need to eventually pay off the increased borrowing that it is having to incur, but will also want to keep interest rates low and to pump money into the economy to stimulate it. This in turn would be expected by economists to create inflationary pressures and the response to this should be to raise interest rates. But inflation also reduces debt in real terms, including Government debt, and this may be the lesser of two evils...
Continued in the full report - please click below to open...
Click here to read our full report

The North / South divide excluding Greater London can be seen below:

Click here to explore historical house sale prices
Click here for the New Build Index archive
LSL market intelligence indices and reports


