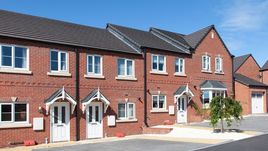
As we embark on the second quarter of the year, it will be interesting to see how prices for new build properties will change over the next few months and how the referendum, in particular, might impact on consumers decision to buy. Over the last year – to the end of March 2016 – we’ve seen new build house prices, on average, rise by 6% - slightly less than the 7.2% increase recorded in the year to March 2015 - but there are strong regional variations as Shaun Peart, Managing Director for LSL Land & New Homes comments:
“At -0.5%, the North East is the only region that saw a price fall over the last year, compared to the same period to March 2015, with regions in the South, other than Greater London, seeing growth of between 6% and 10%. The remaining regions are seeing growth of between 4.7% - in the North West – to 1.3% in Scotland where, along with Yorkshire, the West Midlands and the Humber join the North East in experiencing growth levels below those achieved last year.
Looking at Greater London, in particular, prices are now starting to level with an average growth rate of around 9% as large areas become populated with new build property, predominantly flats...
Click here to read our full report

Click here to view an interactive price-change map


