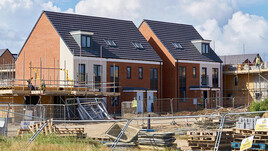
In the year to end Mar 2019 new build prices per m² rose by an average of 2.88% across the UK…
The New Build Property Market
The ONS UK House Price Index for the year to February 2019 continues to show a mixed, but generally stable, housing market. Average UK house prices increased by just 0.6% in the year to February 2019, which is the lowest annual rate since September 2012 when it was 0.4%. A good part of the UK’s Housing market activity occurs in Greater London and the South East and these areas are continuing to slow, albeit at a modest pace. Four years ago strong price rises in these regions was pulled the rest of the UK along, but now they are producing a drag on house price growth when looking at the UK as a whole. The ONS report that the average UK house price peaked at £232,000 in August 2018, in February 2019 the average was £226,000.
Looking at the UK countries, Northern Ireland appears to be performing best with a year on year price growth of 5.5% to Q4 2018, followed by Wales which enjoyed 4.1% growth in the year to Feb 2019 and England with 0.4%. Scotland is the only country presently experiencing price falls with a drop of 0.2% in the year to Feb 2019.
Within England, and at a regional level, prices in London fell by 3.8% over the year, followed by the South East where prices fell by 1.8%. At the other end of the country the North East saw a fall of just under 1%, whilst Yorkshire and the Humber appears to be largely static. The North West saw the strongest house price growth over the period with a figure of 4%, followed by the West Midlands with 2.9%. The South West and East Midlands were in the 1 to 2% bracket whilst the East saw around 0.5% growth. Other indices report a generally similar pattern although there are differences at a regional and country level...
Continued in the full report - please click below to open...
Click here to read our full report

The North / South divide excluding Greater London can be seen below:

Click here to view an interactive price-change map
Click here to explore historical house sale prices
Click here for the New Build Index archive


