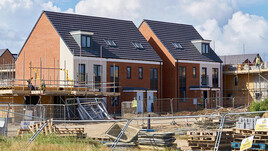
In the year to end July 2019 new build prices per m² rose by an average of 3.16% across the UK...
The New Build Property Market
Although relatively subdued, the drivers of the housing market are in good shape: inflation and interest rates are low, employment levels and wage growth are high and the shortfall of the housing stock relative to need continues to grow. Recently published international data has shown that more than 30 central banks around the world have cut interest rates this year in response to concerns about slowing global growth, heightened trade tensions and the increased likelihood of a no deal Brexit. So the direction of UK interest rates is likely to be downwards which will translate into cheaper mortgages for house buyers.
The latest UK Finance mortgage data for the period to June 2019 cover trends in mortgage lending across different groups in the UK. New First Time Buyer mortgages were down 1.5% in June 2019 on a year earlier, standing at 32,760. The average FTB Loan to Value was 76.9%, 0.3% more than one year earlier. The average FTB age was 32, the average income multiple was 3.51 and the average loan size was £172,158. 31,000 home mover mortgages completed in June 2019, which is 3.6% down on the same month last year. The average home mover Loan to Value was 67.7% which is 0.8% more than the same month last year. The average home mover age was 40, the average income multiple was 3.28 and the average loan size was £225,756...
Continued in the full report - please click below to open...
Click here to read our full report

The North / South divide excluding Greater London can be seen below:

Click here to explore historical house sale prices
Click here for the New Build Index archive
LSL market intelligence indices and reports


