AVERAGE GROWTH IN NEW BUILD PRICES REMAINS STEADY BUT CHALLENGES REMAIN
- New Build Prices rise in July for the third successive month - on average by 5.6%
- North/South divide remains with Greater London seeing growth rate of 8.5% - although down on last years’ figure of 11.3%
- Land availability and planning application delays remain stumbling blocks within industry
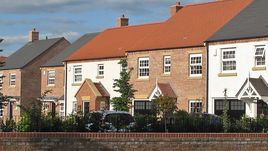
In the year to end July 2016 new build prices rose on average by 5.6% for the third successive month, according to the latest LSL New Build Index, although the regional picture continues to show a North/South divide with crude average growth (excluding Greater London) now standing at 4.0% - down on last year’s figure of 4.3%.
Shaun Peart, Managing Director of LSL Land & New Homes comments: "While average prices have decreased marginally compared to the same period last year, it’s encouraging to see positive growth in most areas with only the North East in negative territory. As previously reported, however, the North / South divide is still evident with the South East seeing the fastest growth rate at 7.0%, closely followed by the South West (6.6%), East Midlands (6.3%) and East Anglia (6.1%). Separately, however, is it Greater London that has retained a slight lead and, although down on last year’s figure of 11.3%, is still in pole position with a growth rate of 8.5%. As the graph illustrates.
In contrast, whilst there is still general growth, prices in the north have risen at a lower rate of just above 2%. It is only the North West - slowing to a 3.1% growth rate - and Scotland which rose to 4.5% (a level not seen since June 2015) that were ahead of the field."
Click here to read our full report

Click here to view an interactive price-change map


