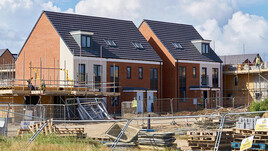
With the introduction of, what the Chancellor claims, is ‘the biggest affordable house building programme since the 1970’s, following his recent Autumn Statement, developers will begin the new year on a high’ with the prospect of even greater new build opportunities to come. And yet, while the news is good for the market, Shaun Peart, Managing Director of LSL Land & New Homes, questions what more could be done to help the market?
“There’s no doubt that the new build market is doing well - as figures from our LSL Land & New Homes Index highlight. Upto the year ending November 2015, for example, there was an average 5.9% increase in new build property prices compared to November 2014 and, whilst slightly down on the 6.7% increase recorded for the period November 2013 to November 2014, it’sclear that London played its part in this with year on year price growth of 16.5% recorded compared to just 8.5% in the last year.
At the moment the three best performing regions of East Anglia, East Midlands and the South East - adjoining Greater London - all show year on year growth of around 2% over last year’s figure and Greater London’s lead position could, as the table shows, soon be taken over by East Anglia....
Click here to read our full report

Click here to view an interactive price-change map


