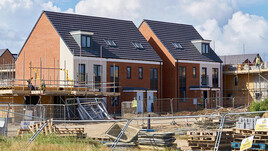
In the year to end Nov 2018 new build house prices rose on average by 3.3% across the UK which is down on last year’s figure of 9.2%
The New Build Property Market
Analysis of new build sales volumes by LSL Land & New Homes looks at transaction volumes through time on a month by month basis to the end of May 2018. It now looks highly likely that 2017 will prove to have been the peak year for new build transactions in the current residential property market cycle. As the signs of a slow-down continue to grow, the good news is that employment remains at its highest ever level, there is growth in real earnings and interest rates remain low.
The chart showing the average purchase price of new build detached properties over time records an uplift of around 15% between 2007 and 2018. With an average level of inflation of 2.8% since 2007 (BOE), in real terms this figure is less positive. In the main this reflects the fact that detached houses are mostly built in lower density regions where prices have not risen as much. But it also shows that there hasn’t really been much of a ‘boom’ in this cycle for most of the country, so hopefully the foundations of a ‘bust’ have not been laid.
Mortgage valuation data is analysed to look at average selling prices of new build housing through time. The year on year figures show that overall prices have grown by 3.3% over the year ending November 2018 compared to 9.2% for the year ending November 2017....
Continued in the full report - please click below to open...
Click here to read our full report

The North / South divide excluding Greater London can be seen below:

Click here to view an interactive price-change map
Click here to explore historical house sale prices
Click here for the New Build Index archive


