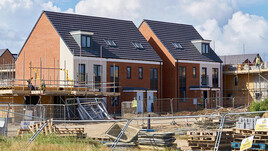
In the year to end January 2018 new build house prices rose on average by 9.8% across the UK which is up on last year’s figure of 5.8%
Political Events
Help to buy: Equity loan transactions now represent about one third of new build sales. The scheme comes to an end in 2021 and some forward planning will be needed to prepare for this change in the demand base. The recently published Lloyds Bank House Building Report 2018, finds that over four in five (house builder) respondents to their survey finds the scheme to be fairly or very important to the industry.
One way in which the Land Registry is trying to speed up and secure property transactions is through ‘Digital Streets’. The aim is in part to speed up and reduce risk in the conveyancing process. Of course this sort of thing is particularly important to house builders as one title deed gets split down to many and anything that can simplify the surrounding legal complexities is to be welcomed.
Market forces are pushing change in terms of construction techniques and labour availability and this is discussed below.
The New Build Property Market
The UK Finance Mortgage Trends survey came out in January and reported some slightly mixed news on the mortgage front.
It reports that mortgage lending to first time buyers, home movers and buy to let were all slightly down in December 2017 compared to the same month last year. But that said, 2017 saw the highest number of first time buyers since 2006, standing at 365,000. And of course the good thing about first time buyers is that for the most part they start buyer chains.
Their research also finds that the average age of a first time buyer is 30 with an income of £40,000, an LTV (loan-to-value ratio) of just under 85% and loan of £138,000. The average Home mover is 39 with an income of £54,000. Their average LTV is just under 73% and average borrowing is £175,000...
Continued in the full report - please click on the link below to open...
Click here to read our full report

The North / South divide excluding Greater London can be seen below:

Click here to view an interactive price-change map


