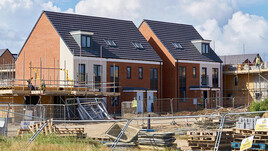
In the year to end Jan 2019 new build prices per m² rose by an average of 3.87% across the UK…
The New Build Property Market
In ‘The Long View’ section below we look at the growth of ‘cities’, both globally and within the UK. The Hometrack ‘UK Cities House Price Index’, looks at house price movement at city level across 20 cities. It finds a general weakening in prices in the Southern cities which have enjoyed most growth since the 2007/8 downturn, and an uplift in prices in the Midlands and North which have seen only limited growth during this period. Birmingham, Cardiff, Edinburgh, Liverpool, Leeds, Manchester, Nottingham and Sheffield have all seen healthy growth in the 5 to 7% range over the twelve months to December 2018. Aberdeen, Cambridge and London are seeing price falls whilst most other Southern based cities are seeing rises of around 2%.
The new style LSL Land and New Homes infographic (next page) looks at the the percentage change in prices by property type over the past year in the North and South. Average £psm selling price, based on Gross External Areas is also shown at regional level, again by property type.
At the National level, the main housing market price indices are edging below the 1% year on year house price growth mark. At the regional level the picture is generally of a flat or slightly declining South, with a more buoyant Midlands and North. In many areas prices have not risen significantly since the last peak, which was over a decade since. Current low interest rates, low inflation and high employment levels, combined with modest growth in real earnings, will all be helping to limit the impact of any slowdown in house price growth....
Continued in the full report - please click below to open...
Click here to read our full report

The North / South divide excluding Greater London can be seen below:

Click here to view an interactive price-change map
Click here to explore historical house sale prices
Click here for the New Build Index archive


