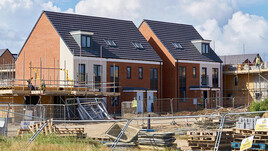
In the year to end December 2019 new build prices per m² rose by an average of 2.03% across the UK...
The New Build Property Market
The table to the right (see report) looks at average house prices and changes in prices from the last peak to present day, as well as taking an average of reported house price changes over the past year.
The ‘percentage change average’ column takes the average of annual house price change data from Nationwide Building Society, the Office for National Statistics House Price Index and the LSL Acadata House Price Index. Although this is a crude average it gives a sense of what the general feel is for overall house price movements at regional level, over the past year.
Wales has performed most strongly with 4.7% growth in prices being recorded, followed by the North West, West Midlands and and Yorkshire & the Humber. The North East, East Midlands and South West are all experiencing modest house price growth of up to 2%. Although a lot of price variation is reported in the London boroughs, the average price change for London, the South East and the East all average out at 0%. So it seems likely that high employment, low interest rates and slow house price inflation have combined to help avoid a significant housing market downturn.
The ‘Percentage change from peak’ column takes the average price high-point from each region during the boom which ended in 2007 to 8, according to the region lived in. The high-point is drawn from one of the average regional house price dataset, in the LSL Acadata Regional house price index. The ‘Latest average price’ is also taken from the same dataset and the two columns are combined to calculate the ‘Percentage change from peak’ column. The North East has seen virtually no change since the last peak and Wales fairs a little better with 8.9% growth. The picture seems to be that the closer the region is to London, the better it has performed...
Continued in the full report - please click below to open...
Click here to read our full report

The North / South divide excluding Greater London can be seen below:

Click here to explore historical house sale prices
Click here for the New Build Index archive
LSL market intelligence indices and reports


