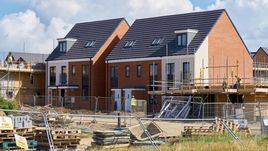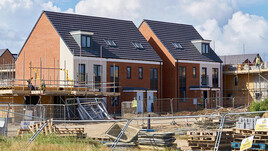
In the year to end December 2017 new build house prices rose on average by 10.8% across the UK which is up on last year’s figure of 6.0%.
This month has seen the launch of ‘Homes England’ as a Key step in the plans to deliver 300,000 new homes a year. Homes England will replace Homes and Communities Agency and its primary role will be in identifying and bringing forward land for development. Chairman of Homes England, Sir Ed Lister said “We will take the lead in delivering better quality homes and great places that set the bar high for others. We will also stimulate demand for Modern Methods of Construction and ultimately disrupt the housing market.”
The focus looks like it will be on affordable housing which will probably lean towards first time buyers. But too much new build being sold to first time buyers could prove to be a double edged sword. If a first time buyer buys new build then the chain stops there, if they buy off another person then often that person will go on to buy another house and so a chain or multiplier begins. And ultimately the buyer of the new build property may then be higher up the chain, perhaps buying a detached rather than a flat. New build should be about filling the gaps in the market, be it flats or semis – and good local knowledge will help to get the site mix right...
Continued in the full report - please click on the link below to open...
Click here to read our full report

The North / South divide excluding Greater London can be seen below:

Click here to view an interactive price-change map


