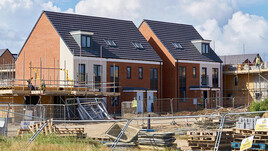
In the year to end Feb 2019 new build prices per m² rose by an average of 3.68% across the UK…
The New Build Property Market
Although the UK feels to be weighed down by uncertainty and concern, there are some positive readings from both the housing market and within the wider economy.
UK Finance reported last month that in 2018 the number of First Time Buyers reached its highest level for 12 years. In 2018, 370,000 First Time Buyer mortgages were completed, which was 1.9% higher than the 2017 figure. UK Finance reports that the number of such First Time Buyer mortgages stood at 402,800 in 2006. The amount of lending to First Time Buyers was 4.9% up on 2017, standing at £62 billion. Given the present uncertainty, this is of course good news, particularly as FTB’s often start buyer chains which will benefit home movers and house builders alike.
In December 2018 the slight increase in FTB activity was offset by a similar, marginal, decrease in Home mover activity. UK Finance note however that there are quite high levels of remortgaging both in the existing home owners and Buy to Let sectors, as owners look for better mortgage rates to reduce their costs.
The Halifax have taken the above UK Finance data and have analysed it along with their own mortgage data. They found that the majority of homes bought with a mortgage in the UK are now for FTB’s, the first time that this has happened since 1995. In 2008 FTB’s numbered 192,300, and by 2018 this number had grown to 372,000. Over this period the Halifax found that the price of an average home had increased from £153,030 in 2008 to £212,473 in 2018. The average deposit that a UK FTB needs to get on the property ladder is £32,841, although the amount needed in London is more than three times this amount....
Continued in the full report - please click below to open...
Click here to read our full report

The North / South divide excluding Greater London can be seen below:

Click here to view an interactive price-change map
Click here to explore historical house sale prices
Click here for the New Build Index archive


