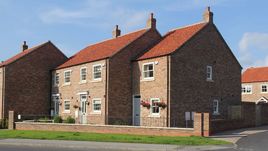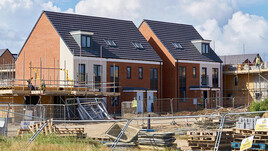
In the year to end May 2017 new build house prices rose on average by 5.5% across the UK which is marginally down on last year’s figure of 5.6%
If Greater London is taken out of the calculation and we take a crude average of the remaining regions, then the average house price growth is 4.3% compared to a figure of 4.0% last year. Looking across the regions it can be seen that the roll out of the housing market recovery has continued and some sustained price rises are now evident in all regions. That said some Northern areas are still achieving average sale prices that are below the peak years around 2007.
Although there are some more mixed reports coming out of the Greater London market, and the consequences of Brexit and the General election are yet to crystallise, we still believe that this region, taken as a whole is the best performing region. In the year to end May 2017, the South East is following close on Greater London’s heels in second position and close behind that is the East Midlands where the market certainly appears to be strengthening. Some of the heat seems to have come out of the market in East Anglia where year on year growth has fallen from 7.1% last year to 5.9% this year. Similarly the South West market has remained static at 5.8%. This is of course a healthy rate and indicates that demand for new build continues to outstrip supply but not at an accelerating rate.
With the exception of the North East, the remaining regions are achieving house price growth at or above the consumer price inflation figure. Generally speaking these regions are also showing some acceleration in the rate of price growth which suggests that there may still be some way to go for them.
Note: This month’s figures are based on projected data, generated whilst work is being undertaken on the data collection system.
Click here to read our full report

Click here to view an interactive price-change map


