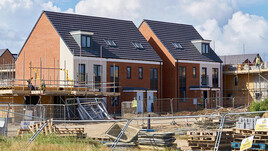
In the year to end April 2018 new build house prices rose on average by 7.6% across the UK which is up on last year’s figure of 7.2%
The New Build Property Market
The latest mortgage trends data from UK Finance has noted a small year on year increase in first time buyer lending in the period to March 2018. At just over 30,000 the number of loans was slightly down on a year earlier but at £5.1 bn the amount of lending was slightly up. At £6.1bn, home mover lending was 4.7% down on last year and the number of mortgages was also down 7.8% on the same period last year. Buy to let lending, which represent under 10% of lending by volume was down nearly 20% on last years figures. So the overall picture is down, but it may well be that the cold spell at the start of the year may have cooled the housing market, as well as activity on building sites.
UK Finance data shows that the average First Time Buyer is now aged 30 and has a gross household income of £42,000; whilst the average home mover is 39 and has a gross household income of £56,000.
The slow-down in the mortgage market was predicted last year, but it does run alongside the ongoing shortage of property that estate agents have for sale. There is no doubt that in much of the country, correctly priced property continues to find plenty of interest and it is not unusual to have a number of bidders on a sale.
It is always useful to look at the Society of Motor Manufacturers and Traders updates for an indicator of consumer confidence. In April 2018 new car registrations were 10.4% up on the corresponding period last year. But in the year-to-date, the total sales are 8.8% down on last year, with continued uncertainty being identified as the cause of the slow-down.
Last year did however see some uncertainty over vehicle excise duty, and the two most notable trends within the sales data are the rapid rise in alternatively-powered vehicles and the ongoing decline in the sales of diesel vehicles....
Continued in the full report - please click below to open...
Click here to read our full report

The North / South divide excluding Greater London can be seen below:

Click here to view an interactive price-change map


