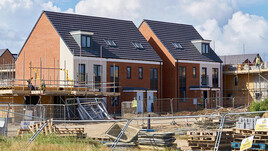
In the year to end August 2019 new build prices per m² rose by an average of 3.00% across the UK...
The New Build Property Market
The LSL Acadata HPI provides detailed analysis of the entire housing market on a rolling monthly basis. It includes all sales data (both cash purchases and mortgaged purchases) and overcomes the delays that occur in registering property sales.
The overall picture for England and Wales is of a static market in terms of house prices. Within England and Wales, Wales is the best performing area with prices up by 2.5% but this is below Scotland where average prices have risen by 3.1%. Notably transactions in Scotland are also 4% higher in 2019 than they were in 2018, which is a clear indicator of market activity.
In terms of the English regions, the North West performs best with 1.7% growth and most other regions, including Greater London have between 0 and 1% growth. The East of England and South East are the only two regions seeing price declines (-0.5% and -0.8% respectively) on an annual basis. Modest growth in both inflation and real wage growth are now outrunning house price inflation in England which means that house prices in real terms are falling or in this sense becoming more affordable...
Continued in the full report - please click below to open...
Click here to read our full report

The North / South divide excluding Greater London can be seen below:

Click here to explore historical house sale prices
Click here for the New Build Index archive
LSL market intelligence indices and reports


