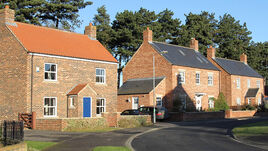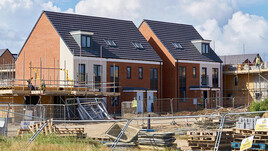
In the year to end June 2019 new build prices per m² rose by an average of 4.35% across the UK...
The New Build Property Market
With a new Prime Minister, who could in short order be replaced by another new Prime Minister, and a Brexit outcome that could be anywhere between an agreed settlement and no deal; it is clear that we continue to live in uncertain times. Whilst not as dramatic, things are equally uncertain in the housing market, with some sources finding reason for enthusiasm, whilst others see a market downturn and others again suggest a thriving new build market. But whilst the political and property environments are producing mixed messages, the general economic background does show some signs of stagnation.
The Royal Institution of Chartered Surveyors (RICS) carries out a monthly survey of their members. It has reported that in June there was the first increase in new buyers since November 2016. The RICS has identified various signs indicating that the market is starting to stabilise. For the first time since 2016, sales and new instructions started to pick up in June, and after four months of decline the measure of price changes indicated stabilisation.
Whilst the RICS does not see cause for unbounded optimism, they see that prices seem on average to be settling down and that the low interest rate environment, combined with record employment levels and a shortage of homes for sale, are putting a floor under prices...
Continued in the full report - please click below to open...
Click here to read our full report

The North / South divide excluding Greater London can be seen below:

Click here to explore historical house sale prices
Click here for the New Build Index archive
LSL market intelligence indices and reports


